
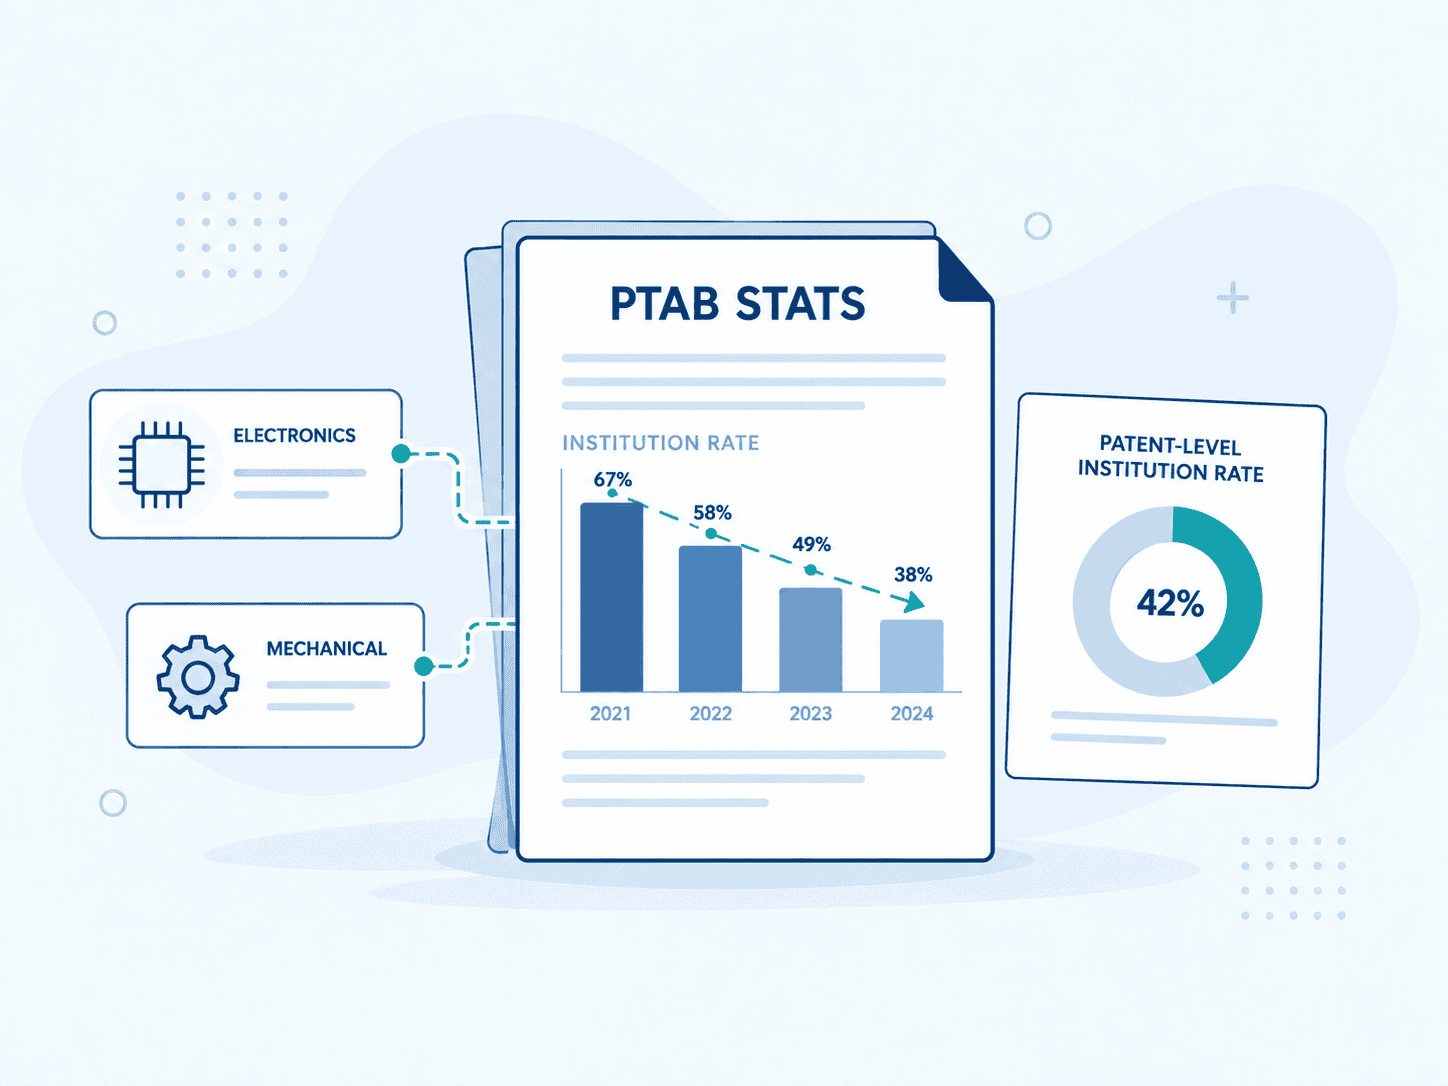
A statistic saying that patents are “invalidated” in inter partes review can sound alarming until you ask what the denominator is. IPR patent invalidation rates can refer to the percentage of petitions instituted, the percentage of patents that reach a final written decision, the percentage that lose at least one challenged claim, or the percentage that lose every claim addressed by the Board.
Those are very different measurements.
That distinction matters to patent owners evaluating enforcement risk, companies responding to infringement allegations, and anyone trying to interpret Patent Trial and Appeal Board data. This guide focuses on the practical question behind the statistics: how often challenged patents actually lose claims, and what those numbers do and do not tell you about the strength of an individual patent.
Key Takeaways
- An IPR institution rate does not tell you how often patents are ultimately invalidated.
- PTAB statistics use several different denominators, including petitions, patents, institution decisions, and completed proceedings.
- In fiscal 2026 through August, the USPTO reported a 40% institution rate by petition and a 43% institution rate by patent.
- A patent can survive an IPR completely, lose only some challenged claims, or lose all claims addressed in a final written decision.
- The most useful risk analysis is claim-specific and prior-art-specific, not based on a single national percentage.
What IPR Patent Invalidation Rates Actually Measure
Inter partes review, or IPR, is an administrative proceeding before the Patent Trial and Appeal Board that allows a party other than the patent owner to challenge one or more issued patent claims.
Under 35 U.S.C. § 311, an IPR challenge is limited to patentability grounds under Sections 102 and 103 and must rely on prior art consisting of patents or printed publications.
That limitation is important because IPR is not a general proceeding for attacking a patent on every possible validity theory. Issues such as certain Section 101 eligibility arguments or Section 112 written-description problems are outside the ordinary statutory scope of an IPR.
Patent owners who want a broader explanation of terms such as prior art, claim construction, patent invalidity, and inter partes review can also consult the PatentAttorney.com patent glossary.

There Is No Single “IPR Invalidation Rate”
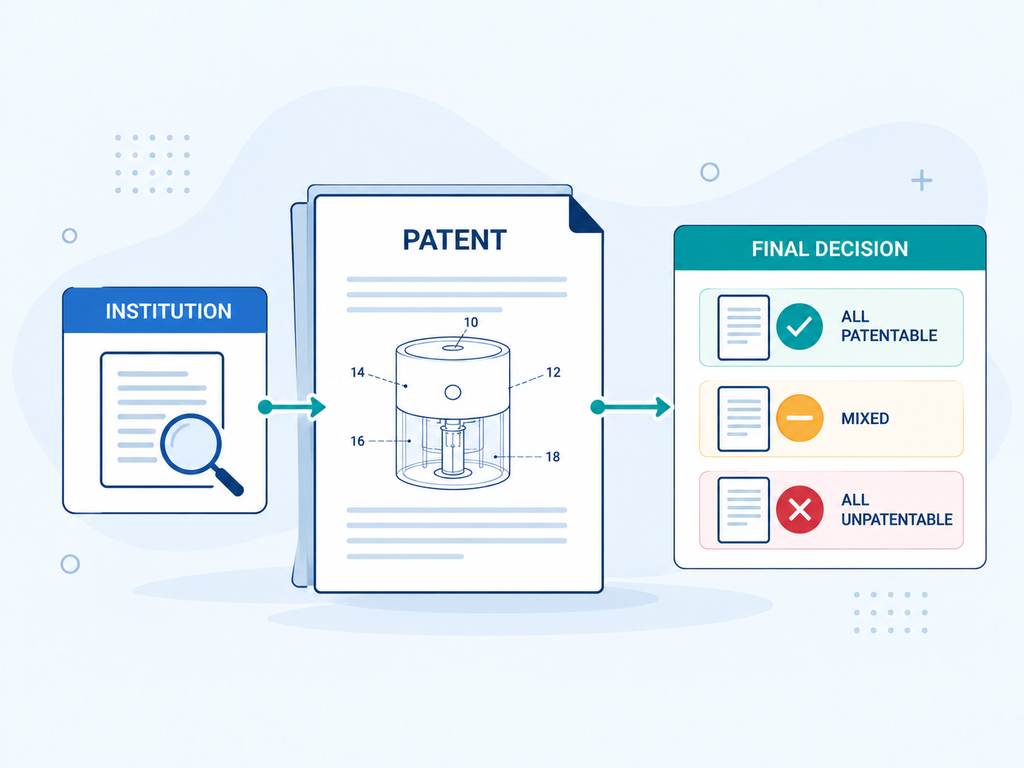
A useful way to interpret PTAB statistics is to separate the proceeding into three stages:
| Stage | Question being measured | What the statistic tells you |
| Petition | Was an IPR challenge filed? | How often patents are challenged |
| Institution | Did the USPTO allow the challenge to proceed? | How many petitions cleared the institution stage |
| Final written decision | Which challenged claims were found patentable or unpatentable? | What happened after a trial reached a merits decision |
Mixing these stages can make the same data appear much more or less threatening than it actually is.
For example, suppose 100 petitions receive institution decisions and 40 are instituted. That produces a 40% institution rate.
Now suppose only 22 of those proceedings ultimately reach final written decisions because others settle or terminate. If 15 of those final decisions include at least one unpatentable claim, someone could report a roughly 68% “invalidation rate” among final decisions.
Both percentages could be mathematically correct. They answer different questions.
That is the first rule for reading IPR patent invalidation rates: always identify the denominator before relying on the percentage.
What Current PTAB Statistics Show
The USPTO publishes monthly PTAB trial statistics and periodic outcome reports rather than one universal “patent cancellation rate.”
The USPTO’s PTAB statistics and trial reports show that, through August 2026, fiscal-year institution rates were substantially lower than they had been in several preceding years.
IPR Institution Rates Have Changed Significantly
For institution decisions measured by petition, the USPTO reported:
| Fiscal year | Instituted | Denied | Institution rate |
| FY2022 | 769 | 398 | 66% |
| FY2023 | 752 | 375 | 67% |
| FY2024 | 740 | 347 | 68% |
| FY2025 | 616 | 616 | 50% |
| FY2026 through August | 356 | 545 | 40% |
Measured by patent, the pattern is similar but the percentages differ:
| Fiscal year | Institution rate by patent |
| FY2022 | 69% |
| FY2023 | 72% |
| FY2024 | 74% |
| FY2025 | 53% |
| FY2026 through August | 43% |
The difference exists because multiple petitions can target the same patent. A petition-level statistic and a patent-level statistic therefore should not be treated as interchangeable.
Technology Affects the Institution Rate
Aggregate numbers also hide substantial differences between technology areas.
For FY2026 through August, USPTO data reported institution rates of:
- 51% for Bio/Pharma
- 49% for Chemical
- 35% for Electrical/Computer
- 45% for Mechanical and Business Methods
- 100% for Design, although that figure was based on only two institution decisions
That final example shows why raw percentages require context. A 100% rate based on two decisions does not carry the same statistical weight as a 35% rate calculated from hundreds of decisions.
For a patent owner, the practical lesson is that broad PTAB statistics should be treated as context, not a personalized prediction.
Why Institution Rates Are Not Invalidation Rates
One of the easiest mistakes in interpreting IPR patent invalidation rates is treating institution as if the patent has already lost.
It has not.
Under the institution standard in 35 U.S.C. Chapter 31, an IPR may be instituted only if the record shows a reasonable likelihood that the petitioner would prevail with respect to at least one challenged claim.
Institution therefore means that the challenge may proceed. It is not a final ruling that a claim is invalid.
Final Written Decisions Tell a Different Story
If an instituted IPR is not dismissed or otherwise terminated, the PTAB can issue a final written decision addressing the patentability of the claims before it.
USPTO outcome reporting commonly distinguishes among three useful categories:
- FWD All Patentable: all claims addressed in the decision were found patentable.
- FWD Mixed: at least one claim was found patentable and at least one was found unpatentable.
- FWD All Unpatentable: all claims addressed in the final written decision were found unpatentable under the applicable reporting methodology.
That distinction is critical. “Patent invalidated” can misleadingly suggest that an entire patent disappeared when the actual outcome may have been cancellation of only some claims.
A Concrete Example From PTAB Outcome Data
The USPTO’s FY2026 second-quarter outcome roundup covered 789 patents reaching reported outcomes between October 1, 2025 and March 31, 2026.
The reported patent-level outcomes included:
| Outcome | Patents | Share of reported outcomes |
| Institution denied | 401 | 51% |
| FWD all unpatentable | 134 | 17% |
| FWD mixed | 47 | 6% |
| FWD all patentable | 44 | 6% |
| Settled | 101 | 13% |
| Dismissed | 26 | 3% |
| Requested adverse judgment | 24 | 3% |
| Mixed outcomes | 12 | 2% |
Now look at the same data through two denominators.
Across all 789 reported patent outcomes, 134 patents, or about 17%, were classified as having all claims at issue in a final written decision found unpatentable.
But if you look only at the 225 patents in one of the three final-written-decision categories, 134 had all claims at issue found unpatentable and another 47 had mixed results. That means roughly 80% of patents in those final-written-decision categories had at least one claim found unpatentable.
Those figures sound dramatically different because they measure different populations.
Neither should be described simply as “the IPR success rate” without explaining the denominator.
How to Interpret IPR Statistics for Your Own Patent
National patent validity statistics can provide useful background, but they cannot tell you whether a particular claim will survive a particular challenge.
A practical analysis should move from general statistics to the specific patent record.
Start With the Actual Challenged Claims
An IPR does not evaluate a patent as an abstract invention. It evaluates identified claims against identified prior art and legal arguments.
That means the first practical question is not:
What percentage of patents survive PTAB?
It is:
What does the prior art disclose relative to every limitation of the claims likely to be challenged?
That analysis should begin with the patent’s independent claims because they usually establish the broadest combinations of required elements. Dependent claims then add limitations that may create additional distinctions over the cited art.

Patent owners assessing prior art can use this guide to conducting a patent search to understand how searches move beyond product names to technical features, classifications, citations, and alternative terminology.
Examine the Prosecution History
Patent validity analysis should also account for what happened before issuance.
Questions worth examining include:
- Which prior-art references did the examiner already consider?
- Were claims amended to overcome Sections 102 or 103 rejections?
- What arguments did the applicant make about the meaning of particular limitations?
- Did the applicant distinguish earlier references based on structure, function, timing, or another technical feature?
- Are important claim terms likely to become disputed in an IPR?
The prosecution history can reveal both strengths and vulnerabilities that do not appear in headline PTAB statistics data.
For example, consider a hypothetical patent claiming a monitoring system with five required limitations: A, B, C, D, and E.
A challenger identifies Reference 1 containing A through D but not E. It then relies on Reference 2 for E and argues that a skilled person would have combined the references.
The statistical question, such as whether 40% or 60% of petitions are instituted, tells you very little about that patent.
The relevant questions are much narrower:
- Does Reference 2 actually disclose limitation E?
- Would the proposed combination have made technical sense at the relevant time?
- Has the petitioner explained why a person of ordinary skill would combine the references?
- Does combining them change the operation of Reference 1?
- Does the specification or prosecution record support a claim interpretation that affects the analysis?
That is where patent-specific risk emerges.
Separate “Some Claims Cancelled” From “Commercial Protection Lost”
Another important distinction is the business effect of IPR claim cancellation.
Imagine a patent with 20 claims. Claims 1, 8, and 15 are independent. An IPR challenges claims 1 through 7, but the remaining claims are not part of the proceeding.
If claims 1 through 7 are ultimately cancelled, saying “the patent was invalidated” would obscure what happened. Other claims may remain in force.
The next question is whether those surviving claims still cover the competitor’s product or the patent owner’s commercially important implementation.
That is why patent survival rate PTAB statistics cannot substitute for claim mapping.
For patent owners already dealing with possible unauthorized use, this patent infringement guide explains why infringement analysis typically starts with individual patent claims rather than whether two products simply look or function similarly.
Use a Three-Denominator Test Before Relying on Any Statistic
A simple review process can prevent most misreadings of IPR outcome data.
Whenever you see a percentage, identify:
1. Population
Is the percentage based on petitions, patents, challenged claims, instituted cases, or completed proceedings?
2. Procedural stage
Does it measure filing, institution, settlement, final written decisions, or post-appeal cancellation?
3. Outcome definition
Does “invalidated” mean at least one claim was found unpatentable, every claim addressed in the final written decision was found unpatentable, or every enforceable claim of the patent was eliminated?
Unless all three are clear, the percentage is incomplete.
This is particularly important when comparing older studies with current IPR outcome data. PTAB procedures, institution patterns, the mix of technologies being challenged, settlement behavior, and the population of cases reaching final decisions can change over time.
What the Statistics Mean for Patent Owners
The current data supports two observations that may initially seem contradictory.
First, getting an IPR instituted is not automatic. For FY2026 through August, the USPTO reported institution in 40% of institution decisions by petition and 43% when measured by patent.
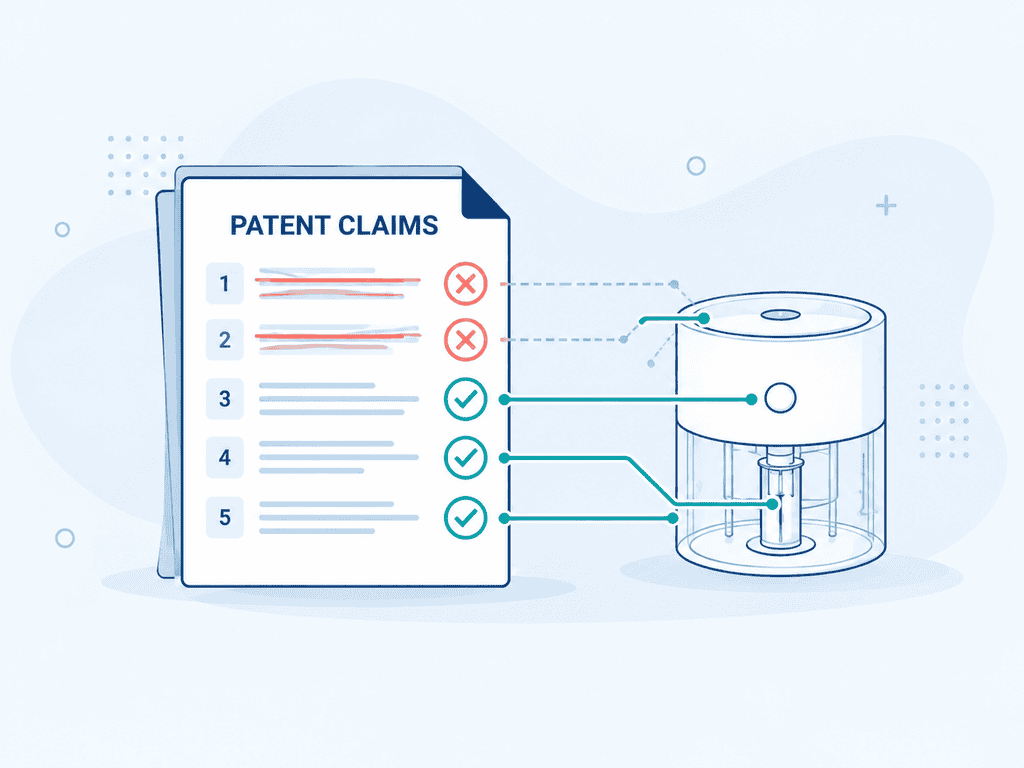
Second, once a patent reaches a final written decision, there can be substantial claim-cancellation risk. FY2026 outcome data includes patents with all claims at issue found unpatentable, mixed outcomes, and all claims at issue found patentable.
Those observations are compatible because they describe different stages of the proceeding.
For a patent owner considering enforcement, licensing, investment, or litigation, the practical response should therefore be more specific than asking whether IPRs are “patent friendly” or “challenger friendly.”
The better exercise is to pressure-test the claims before a dispute develops:
- Identify the closest patents and printed publications.
- Review examiner-cited art and prosecution arguments.
- Map potential prior art against individual claim limitations.
- Identify which claims carry the commercial value of the patent.
- Consider whether stronger dependent claims remain even if a broader claim faces difficulty.
- Review potential claim-construction disputes.
- Separate infringement strength from validity strength.
This kind of preparation does not eliminate PTAB risk. It makes that risk easier to describe in concrete terms.
Conclusion
The headline number is rarely the number that matters most.
IPR patent invalidation rates change substantially depending on whether the denominator is institution decisions, patents reaching any outcome, or patents reaching a final written decision. Current USPTO data shows that many challenges do not reach an instituted trial, while patents that do reach final written decisions can face meaningful claim-cancellation risk.
For an individual patent, however, national percentages are only context. The important analysis remains claim by claim: what prior art exists, what the claims actually require, what the prosecution record says, and which surviving claims protect the patent’s real commercial value.
FAQs
How Often Are Patents Invalidated in IPR?
There is no single percentage that accurately answers this question. In FY2026 through August, the USPTO reported a 40% institution rate by petition, but institution is not invalidation. Among proceedings that reach final written decisions, the percentage involving unpatentable claims is higher because that denominator excludes many denied, settled, or dismissed proceedings.
What Is the Current IPR Institution Rate?
The USPTO’s August 2026 data reports an FY2026 year-to-date institution rate of 40% by petition and 43% by patent. These figures cover institution decisions through August 31, 2026 and should not be interpreted as final patent cancellation rates.
Does Institution Mean the PTAB Thinks the Patent Is Invalid?
No. Institution means the statutory threshold for beginning the review has been satisfied. A final determination of the challenged claims’ patentability comes later if the proceeding continues to a final written decision.
Can the PTAB Invalidate Only Some Claims?
Yes. A final written decision can produce a mixed result in which some challenged claims are found unpatentable and others remain patentable. Losing some claims therefore does not necessarily mean the entire patent has been eliminated.
What Does “FWD All Unpatentable” Mean in PTAB Statistics?
It generally refers to an outcome in which all claims addressed in the final written decision were found unpatentable under the USPTO’s reporting methodology. It should not automatically be read to mean that every original claim in the issued patent was challenged or cancelled.
Why Is the Patent-Level Institution Rate Different From the Petition-Level Rate?
More than one petition can challenge the same patent. Measuring petitions counts each petition separately, while measuring patents focuses on the patents being challenged, so the denominators and resulting percentages differ.
How Can a Patent Owner Estimate IPR Risk Before Enforcement?
Start with a claim-by-claim prior-art review rather than a national PTAB percentage. Examine the strongest potential Sections 102 and 103 references, prosecution-history arguments, likely claim constructions, independent and dependent claim coverage, and which claims actually matter to the product or licensing position.